City report tells us how land has been developed and used in Cape Town
08 November 2023
According to the latest census, Cape Town’s population has increased from 3 740 031 in 2011 to 4 772 846 residents in 2022, an increase of nearly 28% within a decade. The City of Cape Town anticipates more steep increases in Cape Town’s population in coming decades, and needs to plan ahead for the demand this growth will put on scarce resources like developable land, services, and infrastructure. The City’s Spatial Trends and Implementation Tracking Report, issued today on World Town Planning Day, gives an overview of development and land use patterns in Cape Town from 2012 to 2022. Documenting trends is important for estimating a possible and plausible future of a city pressured to handle development and urbanisation. The report will also be used to give guidance on spatial policies and interventions that may be needed in ensuring residents’ quality of life, while protecting our finite natural resources and heritage assets.
‘The City’s spatial strategies and policies – these are the recently revised and approved Municipal Spatial Development Framework, and eight District Spatial Development Frameworks, amongst others – help us to manage urban growth, while creating a balance between development, food security, and environmental protection.
‘The latest census results that were issued last month confirm Cape Town’s phenomenal growth as more and more people are moving here because of the quality of life, economic opportunities, and service delivery. However, given Cape Town’s typography, we have limited land available for development, which means we have to make best use of this scarce resource and in a manner that is cost efficient, and also protective of our natural environment. Where and how we develop land determines how far people need to commute to get to work, and how much the City and its ratepayers need to spend on infrastructure for the provision of water, sanitation, and electricity, and a road network to support mobility. This means, we need to prevent urban sprawl which has a direct impact on economic growth, access to jobs, inclusivity, spatial justice, and the city’s collective resilience to climate change and unforeseen shocks, such as the Covid-19 pandemic,’ said the City’s Deputy Mayor and Mayoral Committee Member for Spatial Planning and Environment, Alderman Eddie Andrews.
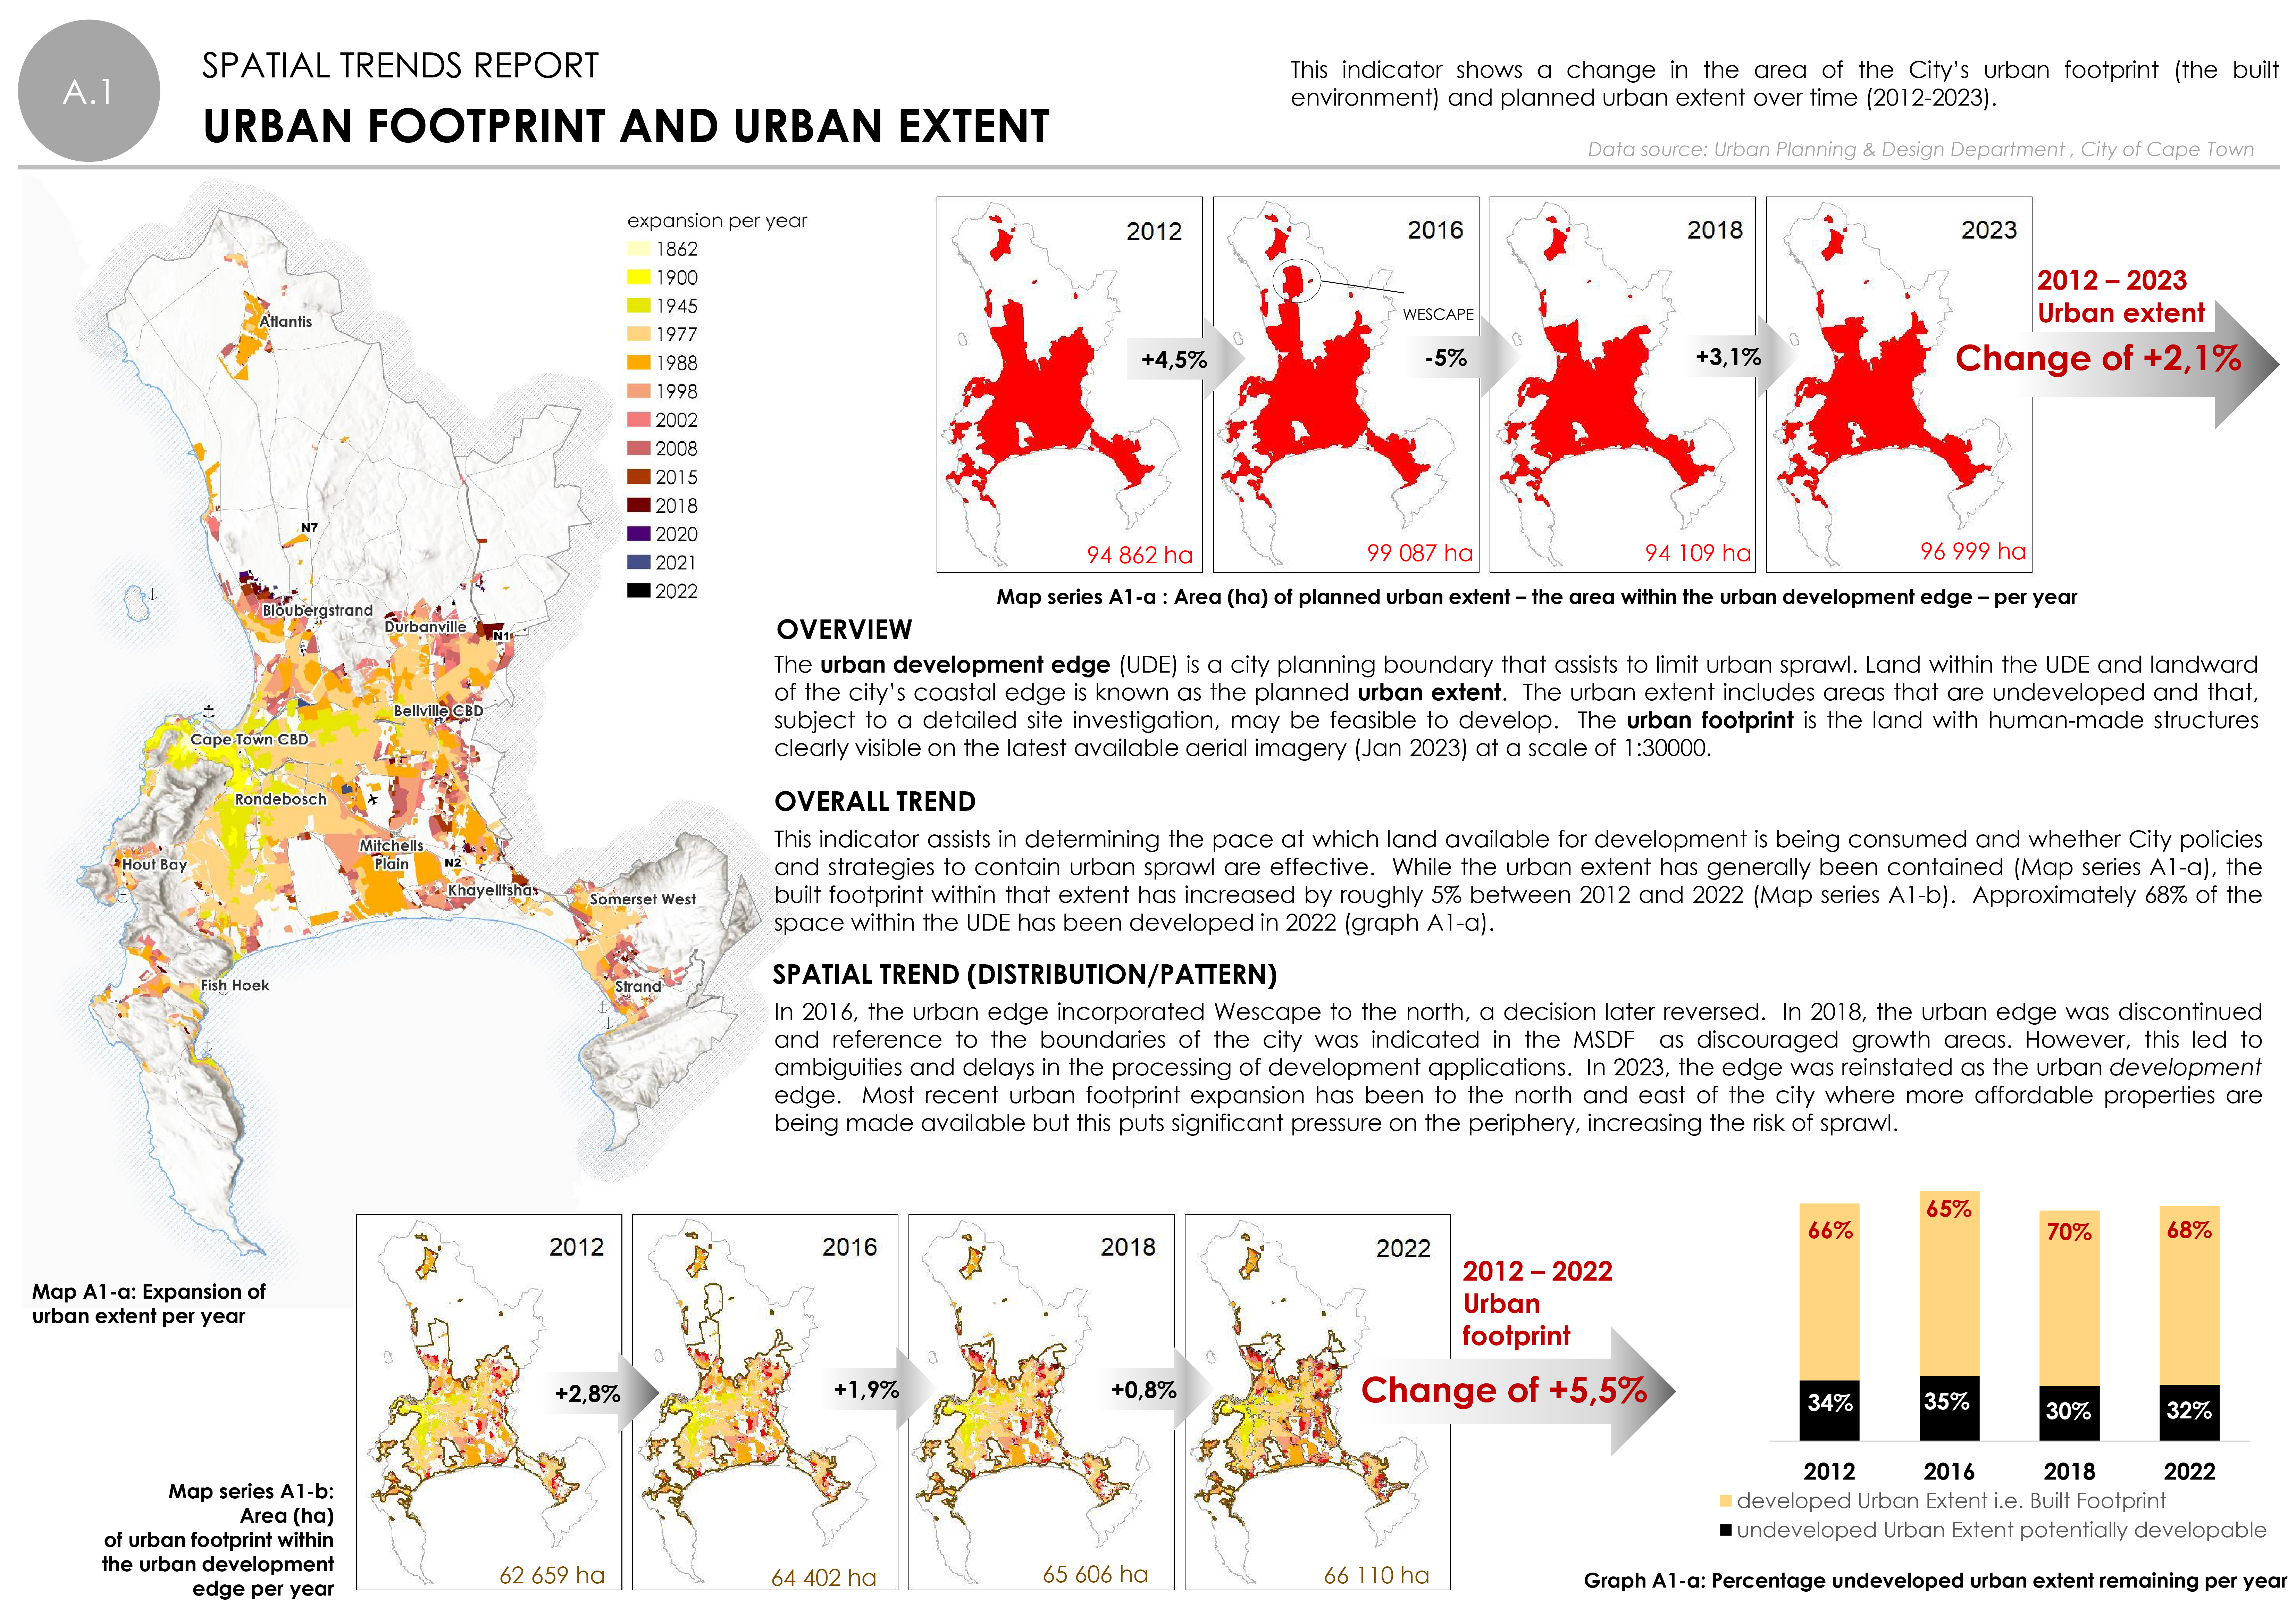
In devising this report, the City’s Urban Planning and Design Department analysed a number of large data sets to determine spatial trends, such as changes in densification and mixed use intensification, the extent of the city’s built footprint and the extent of our natural and agricultural assets. The report also monitors changes in the property market, uptake of new development and human settlement patterns; and tracks public investment and projects aimed at restructuring and upgrading urban areas; and monitors public capital expenditure over time in relation to the City’s spatially targeted areas.
‘I encourage residents and professionals in the urban planning and built environment, academics, and investors to go online, and scrutinise this user-friendly report. The data and trends are depicted in graphics and maps, and key summaries are provided. It is easy to read, and gives an overview of changes in land use and development patterns over the past decade, and also serves as a monitoring record of the impact of our main spatial policies. By looking back and identifying the spatial trends over this period, we can look ahead and plan better, and decide on interventions to cater for a Cape Town that may very likely have double the population it has right now, by 2040,’ said Alderman Andrews.
Some interesting trends:
• The built footprint, or built environment consisting of human-made structures, increased by 3 451 hectares or 5% from 2012 to 2022. This equates to an additional urban footprint added over the past decade equal in size to 16 Century City developments
• The City’s core biodiversity network areas, including rivers and wetlands, are irreplaceable and essential to ensure species survival, resilience to climate change and critical ecosystem functioning. Between 2012 and mid-2022 the City purchased 1 258ha of land for conservation. Similarly, there was an overall loss of 5% in the city’s core biodiversity network and extent of indigenous vegetation – an area of 4 906ha – between 2009 and 2019 due to development, land invasions, etc.
• The number of formal residential dwellings increased from 752 000 in 2012 to 927 000 in 2018, but these exclude the significant growth in households living in informal settlements or illegal occupations
• City-wide, gross residential density has increased by 13% to 13,6 dwellings per hectare, with the Table Bay (this is the CBD, Woodstock, Salt River) and the Khayelitsha, Mitchells Plain, and Greater Blue Downs districts, having the highest gross densities at 20 dwelling units per hectare. This is in accordance with the City’s valuations roll of formal residential units, and excludes the very high densities in informal settlements
• Non-residential buildings are increasingly converted for residential uses; this trend is evident in the CBD, Woodstock, and Salt River in particular
• The greatest increase in non-residential land uses occurred within development corridors such as along Voortrekker Road and in the Southern corridor; and in key employment nodes (CBD, Century City, Bellville, Epping, Somerset West CBD, Blue Downs), with the highest increase in the CBD and Century City between 2012 and 2018. This trend indicates economic growth in the period analysed
• The decline in building plan completions for retail uses between 2016 and 2018 suggests a contraction of retail due to the growth and expansion of the e-commerce sector
• The general decline in building plan completions for offices suggests a contraction of the office sector due to Covid-19 and an increase in remote working
• There is a continued expansion of existing industrial areas potentially influenced by the growth in the online retail market and growing demand for well-located warehousing and distribution centres.
• Nearly 58 000 property transactions to the value of about R130 billion were recorded in 2021 alone
• The following areas show the highest increase in property value between 2012 and 2018: CBD and surrounds; Century City; Claremont, Kenilworth and Wynberg; Kraaifontein; Noordhoek; the metro-south east; and the Somerset West CBD and surrounds. Some of the high increases are attributed to land parcels that were previously vacant and are now fully developed
• The Khayelitsha, Mitchells Plain, and Greater Blue Downs district has seen a significant increase in informality, especially during Covid-19. Driftsands was invaded in 2021 by approximately 11 000 structures. All-in-all there are about 100 000 informal structures in this district
‘The release of this report is very apt as we are celebrating World Town Planning Day today. This year, built environment professionals around the world are focusing on rapid urbanisation, and the challenges it poses to our efforts to ensure resilience and liveable cities. I encourage those interested in these efforts to download our report, and to contribute to the wider conversation about how we can and should prepare for population growth in Cape Town in a responsible manner,’ said Alderman Andrews.
Caption: The City’s Urban Planning and Design Department has published a Spatial Trends and Implementation Tracking Report that provides readers with an overview of how development and land uses have changed in Cape Town from 2012 to 2022. This specific graphic entails the built footprint, and demonstrates an increase of 3 451 hectares or 5% from 2012 to 2022 in human-made structures. The information in the report also helps the City to monitor the impact of its main spatial policies, such as the Municipal Spatial Development Framework and eight District Spatial Development Frameworks on managing urbanisation and development for a growing population.
End
Published by:
City of Cape Town, Media Office